Assessing Hydration Status
There are different reasons for assessing hydration status, and the method of choice will depend on the population of interest, the level of precision required, on the facilities and expertise available, and on budgetary constraints. This article will look at various ways of measuring hydration
Know your terminology!
Hydration – the condition of being hydrated
Euhydration – being in water balance
Hyperhydration – positive water balance or water excess
Hypohydration – negative water balance or water deficit
Dehydration – process of losing body water
Rehydration – process of gaining body water
Why measure hydration?
Normal hydration, often called euhydration, is important for health and wellbeing. Even small losses of body water can have a negative effect on muscle strength, endurance and maximal oxygen uptake.1,2 Hydration may be measured:
- In the laboratory to test the effects of different sports drinks, diets or exercise sessions
- In a clinical environment to ensure the wellbeing of patients
- By the military to ensure that personnel are able to fulfill active duties while remaining healthy
- At major sporting events to ensure that athletes can achieve their potential
- At home to check if someone in the family, particularly an elderly person or child, is drinking enough.
So, what methods should be used in which situations?
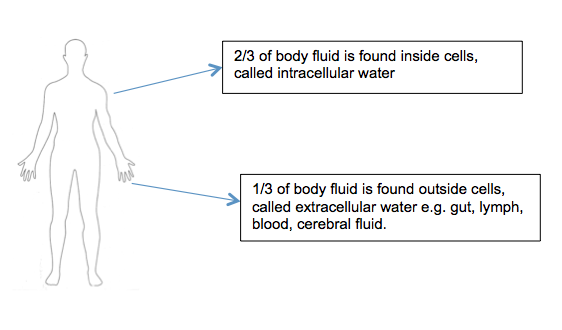
Where is the water in our bodies?
Water makes up 50-65% of the total mass of our bodies. It is present inside cells, in muscle tissue, in the gut, in major organs and even in adipose (fat tissue) which is 10-20% water.3,4
Methods for estimating hydration
It is difficult to measure hydration as it is a dynamic process, i.e. constantly changing, and is different for each individual. Another issue is that many tests of hydration are really looking at ‘change’ rather than absolute hydration level.
Body mass
Acute changes in body mass over a short period of time are commonly assumed to be due to body water loss or gain. As 1ml of water has a mass of 1g,5 changes in body mass can be used to quantify water gain or loss. A study in well-hydrated soldiers undertaking physical activity in hot environments6 found a daily variability of 1% while other studies have found average figures of 0.3%7 and 0.1%8, although in the latter study, individual variation was -800 g to +800 g in subjects with a body mass of 53-68 kg.
Blood
Blood is easily sampled and contains fluid in red blood cells (intracellular) as well as in plasma (extracellular). Changes in blood volume and composition reflect changes in hydration status. Blood tests for hydration will tend to include:
- Haemoglobin concentration and haematocrit
- Sodium concentration
- Osmolality (the measure of solute concentration).
Due to individual variation, it is best not to rely upon a single measure of hydration. For example, in a study where subjects were dehydrated by 2-7% of body mass, some values for plasma osmolality were nevertheless in the normal range.6
Blood: what is normal?
| Haemoglobin Men Women |
– 14.0-17.0 g/dL 11.5-16.0 g/dL |
| Haematocrit: Men Women |
– 42-54% 38-46% |
| Serum sodium | 132-142 mmol/L |
| Serum osmolality | 280-300 mosmol/kg |
Urine
Urine is also easily sampled, although 24-hour urine collections can be onerous for subjects. As the body needs to excrete excess solute daily, the kidneys respond to change in hydration status by increasing or decreasing the volume of urine produced. This helps to defend normal blood volume and, thus, blood pressure. Urine tests for hydration can include:
- Osmolality
- Specific gravity
- Conductivity
- Colour
- Volume
- Frequency.
 Urine: what is normal?
| Osmolality | 300-1200 mosm/kg |
| Specific gravity | 1.010-1.025 g/ml |
| Volume | 30-300 mL/h* |
| Creatinine | 9-16 mmol/24 hours |
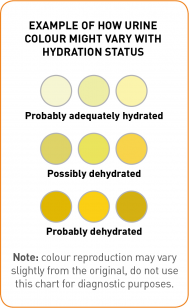
Urine colour is used in many different settings and is determined primarily by the amount of urochrome present.10 Urine has a very pale colour when large volumes of urine are excreted and the urine is dilute, while it has a dark colour when small volumes of urine are excreted and the urine is concentrated. Research has identified linear relationships between urine colour and specific gravity, and between urine colour and conductivity.11 Therefore, urine colour is an acceptable way to estimate hydration status in athletic or industrial settings when a high precision may not be needed or where self-assessment may be required.
Saliva
Saliva flow rate, osmolality and composition have all been identified as potential markers of hydration status. Saliva osmolality rises in cases of acute dehydration (4% loss of body mass) induced by exercise in the heat,12 but there is a large variability in how individuals respond. Saliva osmolality can also be affected by a brief mouth rinse with water which makes it an unreliable marker of hydration status.
Selecting the right methods
There is no single reliable, consistent method for measuring hydration so either a low precision has to be accepted (e.g. in the case of making a general assessment about one’s own hydration or that of a friend/relative) or several methods have to be used in combination.
Home settings – urine colour and volume would be acceptable ways to estimate hydration status, as well as keeping a diary of how much fluid has been consumed. Urine colour charts are available to compare against the colour of sampled urine.
Clinical settings – health care staff normally collect regular data on fluid intakes and urine volume and will have access to blood measures of osmolality, electrolytes and haematocrit when required. In addition, nurses are trained to spot more subjective changes in hydration, e.g. dry mouth, skin turgor and thirst. It is worth noting, however, that all of these measures can be influenced by disease state, certain drugs and clinical interventions.
Research settings – here, a higher level of precision is required so several hydration markers should be used in combination. Urine volume, urinary markers of hydration and blood markers of hydration all tend to be used in research studies. Care has to be taken to standardize subjects before conducting an intervention to ensure that everyone begins the process in a state of euhydration.
Conclusion
While it is important to monitor hydration levels in order to promote health and wellbeing, the practicalities of doing so are not simple due to the dynamic state of hydration and differences in how individuals respond to fluid gains and losses. Often more than one measure of hydration is needed to give a true indication, although visual methods, such as urine output and colour, would suffice in the home setting.
We would like to thankDr Susan Shirreffs for providing the content used as a basis for the text in this section.
References
1. Gigou P-Y, Lamontagne-Lacasse M, Goulet EDB. Meta-analysis of the effects of pre-exercise hypohydration on endurance performance, lactate threshold and VO2max. Med Sci Sports Exerc. 2010, 42, S254.
2. Goulet EDB, Lamontagne-Lacasse M, Gigou P-Y, Kenefick RW, Ely BR, Cheuvront S. Pre-exercise hydration effects on jumping ability and muscle strength, endurance and anaerobic capacity: a meta-analysis. Med Sci Sports Exerc. 2010, 42, S254.
3. Institute of Medicine. Water. In: Dietary reference intakes for water, sodium, chloride, potassium and sulfate. National Academy Press: Washington, D.C. pp. 73–185, 2005.
4. Bender DA & AE Bender. Nutrition a reference handbook. 1997. Oxford University Press: Oxford, 1997.
5. Lentner C. Geigy Scientific Tables, 8th edn. Basle: Ciba-Geigy Limited, 1984.
6. Cheuvront SN, Kenefick RW, Montain SJ, Sawka MN. Mechanisms of aerobic performance impairment with heat stress and dehydration. J Appl Physiol. 2010, 109, 1989-1995.
7. Grandjean AC, Reimers KJ, Bannick KE, Haven MC. The effect of caffeinated, non-caffeinated, caloric and non-caloric beverages on hydration. J Am Coll Nutr. 2000, 19, 591-600.
8. Dore C, Weiner JS, Wheeler EF, El-Neil H. Water balance and body weight: studies in a tropical climate. Ann Hum Biol. 1975, 2, 25-33.
9. Gomez & Park. Key facts in anaesthesia and intensive care. Greenich Medical Media Ltd. 2003.
10. Diem K. Documenta Geigy Scientific Tables. pp 538-539. Manchester: Geigy Pharmaceutical Company Limited, 1962.
11. Armstrong LE, Soto JA, Hacker FT Jr, Casa DJ, Kavouras SA & Maresh CM. Urinary indices during dehydration, exercise, and rehydration. Int. J. Sport Nutr. 1998, 8, 345-355.
12. Ely BR, Cheuvront SN, Kenefick RW, Sawka MN. Limitations of salivary osmolality as a marker of hydration status. Med Sci Sports Exerc. 2011, 43, 1080-4.